Shuffle Master reports record net income in the third quarter

"Innovation has driven the success of the Equinox cabinet and this quarter was no exception with EGM sales of nearly us$ 18 million. Recurring revenue growth of 11% highlights our continued commitment to create greater stability through product leasing. And finally, we remained focused on cost controls as part of an overall effort to drive operational excellence. However, our biggest accomplishment is how we have positioned Shuffle Master to take advantage of significant opportunities across the globe, providing an even stronger foundation for long-term, sustainable earnings growth," Isaacs concluded.
Third quarter 2011 financial results
Total revenue increased year-over-year by 13% to us$ 58.3 million driven by strong Electronic Gaming Machines (EGM) performance and recurring revenue growth in Utility and Proprietary Table Games (PTG). Total recurring revenue was up 11% year-over-year and approximately 2% sequentially, and totaled us$ 26.6 million, or 46% of total revenue.
Gross margin improved year-over-year from 61% to 62% due to improved EGM margins driven by higher average sales prices and value engineering on the new Equinox cabinet. GAAP net income increased year-over-year by 56% to a record us$ 9.1 million. Diluted earnings per share (EPS) was us$ 0.17, as compared to us$ 0.11 in the year-ago quarter.
Besides, adjusted EBITDA totaled us$ 19.5 million, up 25% from us$ 15.5 million in the year-ago quarter and operating income margin increased 540 bps year-over-year to 22%.
Free Cash Flow, a non-GAAP financial measure, was us$ 14 million as compared to us $ 7.7 million in the prior year period. Net debt (total debt, less cash and cash equivalents) was us$ 38.6 million as compared to us$ 56.3 million as of October 31, 2010. The company paid approximately us$ 5 million on its us$ 200 million senior secured revolving credit facility during the third quarter.
International revenue accounted for approximately 54% of total revenues in the third quarter; Australia represented 35% of total revenues. "I believe that our financial strength and flexibility, evidenced by our strong earnings and cash flow trends, enable us to continuously identify and successfully execute on opportunities that increase our value proposition to our customers and our shareholders," stated Linster Fox, the company's CFO.
Third quarter 2011 business segment highlights
Total Utility lease and service revenue was a record us$ 12.4 million and grew 18% year-over-year driven by the Company's strong emphasis on leasing, the accumulation of new lease placements in Macau during the quarter and in other parts of Asia in the prior year, and also as a result of continued i-Deal upgrades.
Total Utility revenue of us$ 22.6 million grew 14% year-over-year due to the increased lease placements in the quarter, and to a lesser extent, an 8% increase in average sales prices as compared to the year-ago quarter.
The company achieved a record lease installed base of approximately 7,800 shufflers, an 18% increase in units year-over-year.
Gross margin declined year-over-year from 60% to 57% due primarily to increased depreciation on newly installed leased shufflers and inventory write-downs on older products.
Approximately 180 new MD2CR shufflers have been deployed; all units are leased. The total i-Deal installed base grew to 3,407 units, a 66% increase year-over-year.
Proprietary Table Games
Total PTG lease, royalty and service revenue for the third quarter increased 11% year-over-year to a record us$ 10.6 million, primarily due to increased placements of premium games, progressives and side bets in the US, namely, Three Card Poker, Ultimate Texas Hold' em, Mississippi Stud, Blackjack Switch, Dragon Bonus and Three Card Poker Progressive. The quarter also included new leased placements of premium games and progressives in Singapore.
Total PTG revenue remained relatively flat year-over-year at approximately $11.0 million, largely as a result of fewer sold units in the quarter.
Gross margin decreased year-over-year from 81% to 79% primarily due to inventory write-downs on older products, and to a lesser extent, fewer conversions of leased to sold units in the quarter. Conversions of leased to sold units initially drive high profit margins. Besides, the progressive add-on installed base grew 231 units year-over-year to 785 units.
Electronic Table Systems (ETS)
Total ETS lease, royalty and service revenue was us$ 3.5 million, down 9% from the year-ago quarter, due to decreased revenue resulting from removals of Table Master seats in Pennsylvania and Delaware in the prior year as those markets transitioned to live gaming. Many of these units have been redeployed but are not generating average lease prices and margins equivalent to the removed units.
Total ETS revenue for the quarter declined by 42% year-over-year to us$ 6.8 million due to a significant decrease in sales revenue. The prior year included significant sales of Vegas Star and Rapid Table Games seats in Australia driven by favorable regulatory changes, as well as sales of Rapid Table Games seats in Singapore.
Gross margin decreased year-over-year from 54% to 47% due primarily to the overall decrease in revenue and the unfavorable margin effect from Table Master removals in the US.
Electronic Gaming Machines
Total EGM revenue grew 96% year-over-year to approximately us$ 18 million, a third quarter record. EGM performance was driven by sales of the new Equinox cabinet, which totaled approximately 800 units in the quarter.
Gross margin increased 1,180 bps year-over-year to 64% due to the increased Equinox placements driving higher average sales prices as well as more efficient production costs from a better designed cabinet.
Total placements of EGM units grew 72% from the prior year period as a result of strong customer demand for the Equinox cabinet.
Further detail and analysis of the company's financial results for the third quarter ended July 31, 2011, is included in its Form 10-Q, which has been filed with the Securities and Exchange Commission.
Italian Gaming Expo & Conference successfully wraps up inaugural edition in Rome

BiS SiGMA Americas opens in São Paulo and expects to welcome 10,000+ visitors, 230 exhibitors

Skilrock Technologies earns two nominations at EGR B2B Awards 2024
Skilrock Technologies earns two nominations at EGR B2B Awards 2024

FBM rolls out online gaming platform FBM E-Motion for the Philippines market

Uplatform partners with Tom Horn Gaming to offer its gaming content through Casino Aggregator

FeedConstruct unveils H2H widget for land-based terminals


Italian Gaming Expo & Conference successfully wraps up inaugural edition in Rome
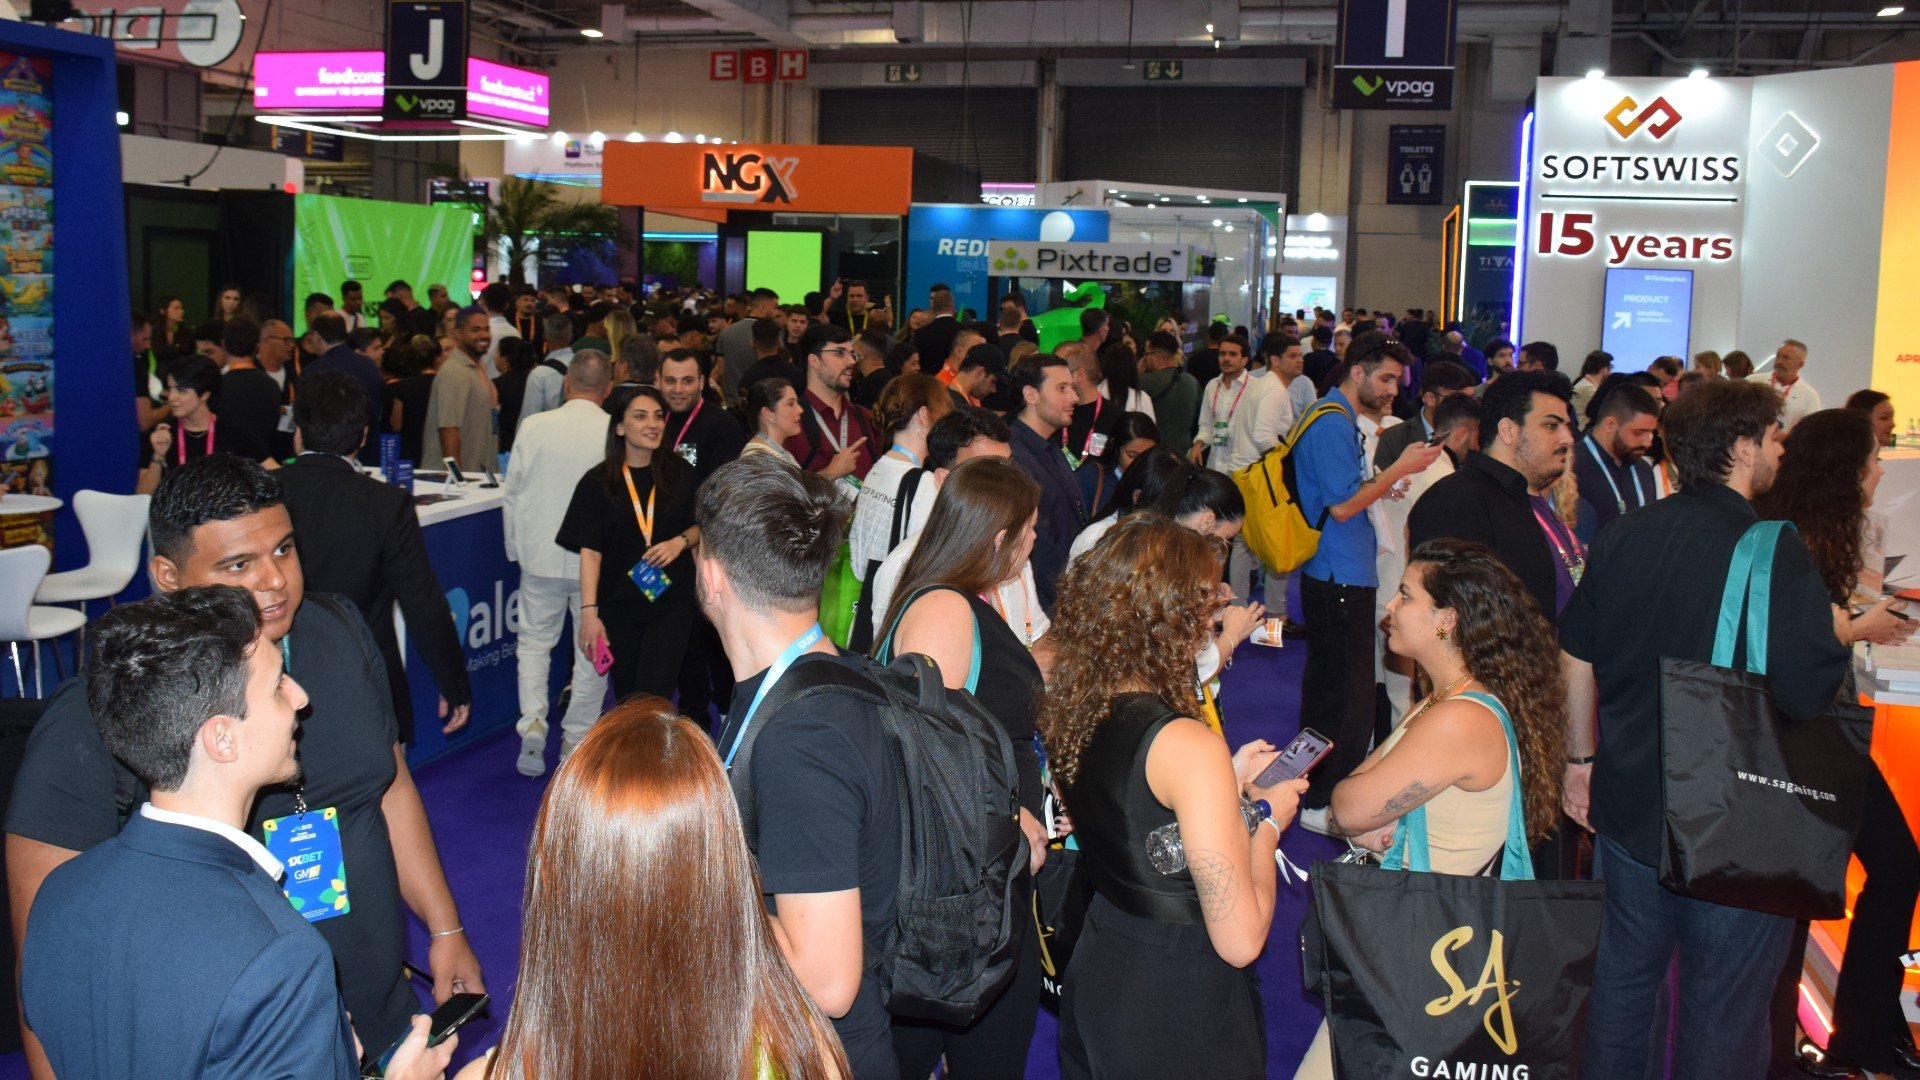
First day of BiS SiGMA Americas 2024 surprises with exhibition size, industry optimism
BiS SiGMA Americas opens in São Paulo and expects to welcome 10,000+ visitors, 230 exhibitors